Teaching Potential Dividers with the BBC Microbit and Physbit
Classroom Lesson Plan for the BBC Microbit
Teaching Potential Dividers with the BBC Microbit and Physbit
In this post, we have provided a complete classroom lesson plan, to aid in the teaching of a potential divider circuit, using the BBC Micro:bit and the Phys:bit board.
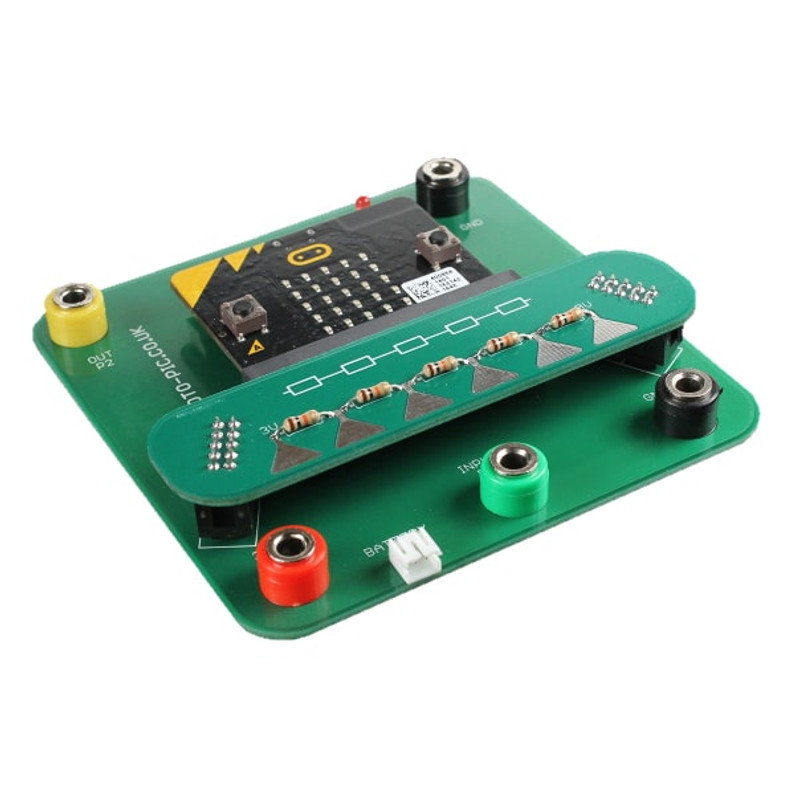
The Phys:bit is an addon system which allows included prewired plugin modules to easily connect to the BBC Micro:bit for teaching various concepts about electricity and electronics.
If you wish to print out this lesson plan, we have a downloadable PDF available here:
The code required for this lesson plan has been written in micropython and can be found below: [code language="python"] from microbit import * quantum = 200 pic05 = Image("99000:99000:99000:99000:99000") pic14 = Image("00000:99000:99000:99000:99099") pic23 = Image("00000:00000:99000:99099:99099") pic32 = Image("00000:00000:00099:99099:99099") pic41 = Image("00000:00099:00099:00099:99099") pic50 = Image("00099:00099:00099:00099:00099") while True: voltage = pin1.read_analog() if voltage <= quantum: display.show(pic05) pin2.write_digital(0) elif quantum < voltage and voltage <= 2*quantum: display.show(pic14) pin2.write_digital(0) elif 2*quantum < voltage and voltage <= 3*quantum: display.show(pic23) pin2.write_digital(0) elif 3*quantum < voltage and voltage <= 4*quantum: display.show(pic32) pin2.write_digital(0) elif 4*quantum < voltage and voltage <= 5*quantum: display.show(pic41) pin2.write_digital(1) else: display.show(pic50) pin2.write_digital(1) [/code]
Potential Divider Circuit and Electricity
Background
A potential divider circuit has multiple uses in electronics. For example, it can divide a larger input voltage to a smaller output voltage for use in a circuit. A potential divider can also use a variable resistance sensor to identify an event when something has become wet, or hot, etc. There are many such sensors that can be used for a variety of purposes, e.g. safety systems, automated systems, alarms, etc.
The word ‘potential’ is used because voltage is defined as the ‘potential difference between 2 points.’ We can get into this later but think of the potential difference between the +ve and -ve terminals of a battery.
Study Material
- Pre-programmed Micro:Bit
- Battery
- Phys:Bit Carrier board
- Phys:Bit Potential divider test board
- Test lead and resistor
Basic Use
- Connect the circuit as shown opposite.
- The test lead is connected to the central (Green) connector.
- The resistor from the test lead is connected to the Ground (Black) connector.
- To select each test Press B on the Micro:Bit.
- To move back by one test Press A.
Start-up
- Switch on the Micro:Bit and an ‘Introduction Message’ is displayed.
- Press B to move to Test 1.
Test 1: Check the Board is Working
- A Zero will be displayed on the Micro:Bit.
- Connect the test lead to test points P0 to P5 shown below.
- If the test is working, then you will see a number (0 to 5) shown on the Micro:Bit display corresponding to each test point.
- Once you have confirmed the board is working, Press B to move to Test 2.
|
Is the equipment working? |
YES / NO |
Test 2: Potential Difference
- For Test 2 you will see a bar on the left and right side of the display that shows the relative voltages V2 and V1. The bar height (0 to 5) represents the voltage level.
- Connect the test lead to test points P0 to P5 and record how the bar height for V2 and V1 varies from 0 to 5 for each test point.
|
Test Point |
V2 bar height (left hand) |
V1 bar height (right hand) |
|
|
P0 |
0 1 2 3 4 5 |
0 1 2 3 4 5 |
|
|
P1 |
0 1 2 3 4 5 |
0 1 2 3 4 5 |
|
|
P2 |
0 1 2 3 4 5 |
0 1 2 3 4 5 |
|
|
P3 |
0 1 2 3 4 5 |
0 1 2 3 4 5 |
|
|
P4 |
0 1 2 3 4 5 |
0 1 2 3 4 5 |
|
|
P5 |
0 1 2 3 4 5 |
0 1 2 3 4 5 |
Circle the number for each bar reading (V2 and V1) for test points P0 to P5.
Test 2 Observations
Describe how V2 and V1 change relative to one another for the different test points?
Test 2 Conclusions
Explain as best as possible why the voltages V2 and V1 are changing as observed?
Once you have finished Test 2, then Press B to move to Test 3.
Test 3: Voltage Measurements
- For Test 3 connect the test lead to test points P0 to P5 and you will see a different voltage number (V) on the Micro:Bit for each test point.
- Record the voltage V for each test point in the table below.
|
Test Point |
P5 |
P4 |
P3 |
P2 |
P1 |
P0 |
|
V (Volts) |
||||||
|
R (Ω) |
50 kΩ |
40 kΩ |
30 kΩ |
20 kΩ |
10 kΩ |
0 kΩ |
|
Resistors |
R5+R4+R3 +R2+R1 |
R4+R3+R2 +R1 |
R3+R2+R1 |
R2+R1 |
R1 |
--- |
Test 3 Results Analysis
Plot Voltage versus Resistance in the Graph below and draw a straight line through the data.
Test 3 Conclusions
Can you explain why there is a straight line through the data in the Voltage versus Resistance graph? (Hint: Ohm’s law)
Once you have finished Test 3, then you are complete, or Press A to redo any work above.
Recent Posts
-
What is Ohm's Law?
Are you curious about how electricity works? Let me introduce you to a very important concept i …9th Mar 2023 -
How do I control a central heating system using an Arduino
To control a heating system using an Arduino, you will need to write a sketch (program) that impleme …7th Feb 2023 -
The Versatility of Slotted Aluminium Extrusions: From Robotics to Camper Van Renovations
In today's ever-evolving world, the need for versatile and adaptable building materials is greater t …25th Jan 2023


